DisasterLens assigns one of the four xBD damage classes to every building in a pair of satellite images taken before and after a disaster: no damage, minor damage, major damage or destroyed.
Drag the white divider on the image, or click anywhere on it, to compare before and after (keyboard: focus the handle and use ← →). After image shown: , from the right.
Outlines: 72 buildings found by the detector on the pre-event image (score ≥ 0.5).
- No damage 43
- Minor 0
- Major 0
- Destroyed 29
- Correct class 42
- Wrong class 11
- No rated building 19
- Missed building 10
42 of 53 rated buildings found get their reference class.
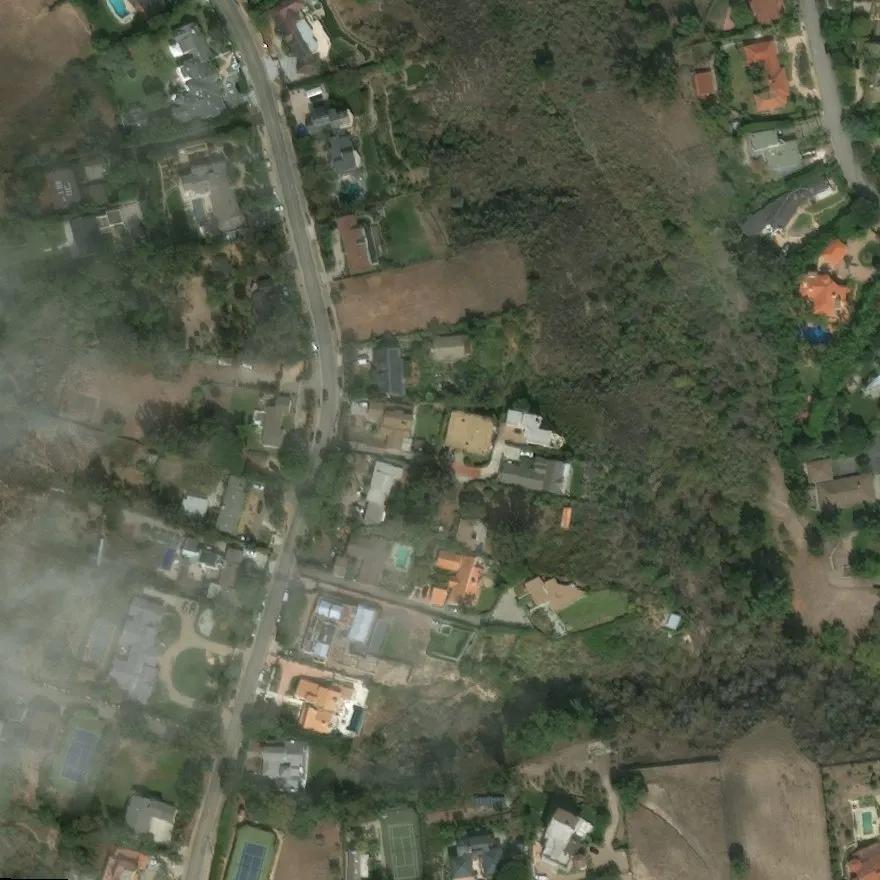
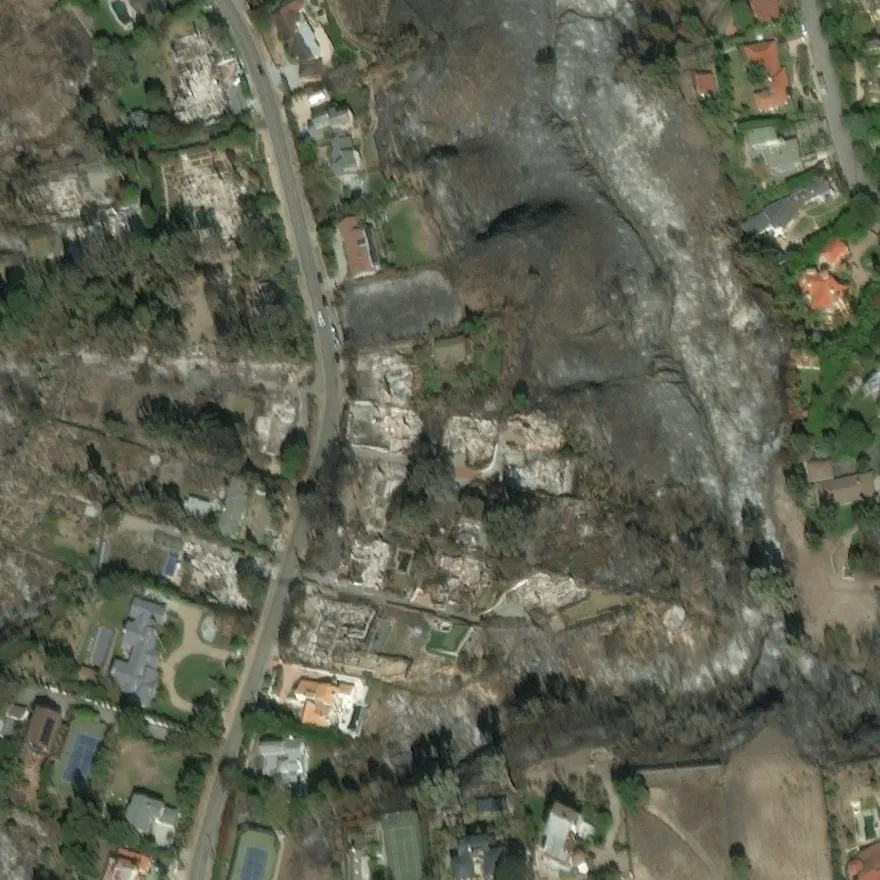 BeforeAfter
Loading scene…
| Footprints | No damage | Minor | Major | Destroyed |
|---|---|---|---|---|
| Known footprints pre-event building outlines given | 97.3% | 61.4% | 72.7% | 84.1% |
| Detected footprints Mask R-CNN, then the same damage model | 63.8% | 42.6% | 60.0% | 64.9% |
The difference between the two rows comes mostly from buildings the detector misses: among the buildings it finds, recall per class is 97% / 59% / 75% / 86%. All model choices were made on a validation split; the test split was scored once.
Task
After a hurricane, flood or wildfire, responders need to know which buildings are damaged. Satellites image the area before and after the event. The task here is to assign one damage class to each building from the two images, either with known building footprints or by detecting the buildings first.
Data
xBD Gupta et al., xBD: A Dataset for Assessing Building Damage from Satellite Imagery (2019) arxiv.org provides pre- and post-event satellite images (1024 × 1024 px) with building outlines and a damage label per building. Its train and test splits, used here, cover ten disasters. 73% of labeled buildings are undamaged, so results are reported as recall per class rather than overall accuracy.
-
Wildfire 31,314 buildings
Santa Rosa and SoCal wildfires
-
Flood 49,433 buildings
Hurricanes Florence and Harvey, Midwest floods
-
Hurricane wind 45,182 buildings
Hurricanes Matthew and Michael
-
Tsunami 43,407 buildings
Palu tsunami (Sulawesi)
-
Earthquake 43,596 buildings
Mexico earthquake (2017)
-
Volcano 712 buildings
Fuego volcano (Guatemala)
Class balance
- No damage 73%
- Minor 9%
- Major 9%
- Destroyed 8%
Splits
| Split | Scenes | Labeled buildings |
|---|---|---|
| Train model fitting | 1,798 | 128,038 |
| Validation all model choices | 443 | 31,756 |
| Test (xBD) scored once | 739 | 53,850 |
Model
Two stages, run at different times.
ABuilding identificationpre-event image · can run before the disaster
 Pre-event image
Mask R-CNN · ResNet-50-FPN
COCO-pretrained, fine-tuned on xBD footprints · 512 px tiles enlarged 2× · score ≥ 0.5
- ResNet-50 stem, stage 1frozen
- ResNet-50 stages 2–4fine-tuned
- FPNfeature pyramid
- RPNproposals, anchors 16–256 px
- RoIAlign + box / mask headsfine-tuned
- Building vs. background, 28 × 28 masknew predictors
Loss: objectness (binary cross-entropy) + proposal box (smooth L1) + building vs. background (cross-entropy) + box refinement (smooth L1) + mask (per-pixel binary cross-entropy), summed with equal weights.
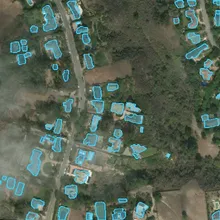 Footprints
Or skip this stage: use known pre-event footprints, for example from a building database aligned to the image.
BDamage assessmentwhen the post-disaster image arrives
Pre-event 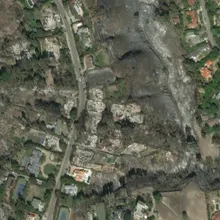 Post-event
DINOv3 ViT-L/16 · one set of weights for both dates
Satellite-pretrained (SAT-493M) · 303M parameters · 24 blocks, 1024-d, 16 heads · 50M parameters fine-tuned
- Patch embedding16 × 16 px patches → tokens
- Blocks 1–20frozen
- Blocks 21–24 + final normfine-tuned
- 64 × 64 × 1024 patch gridper date
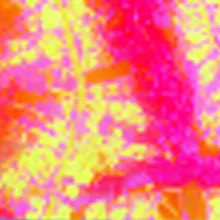 Pre embedding
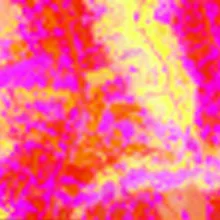 Post embedding Footprints from A
RoIAlign pools a 3 × 3 grid of patch features inside each footprint, on both dates; each building also gets its scene's two context vectors.
- pre building 3 × 3 × 1024
- post building 3 × 3 × 1024
- pre context 1024
- post context 1024
Each vector is projected to 128-d (shared weights per type). The classifier sees the building and its scene after the event, and how each changed:
- post building
- post context
- Δ building = post − pre
- Δ context = post − pre
MLP 512 → 128 → 4 classes. The pre-event features enter only through the two Δ terms.
Loss: cross-entropy over the 4 damage classes, unweighted (the same for the frozen-encoder models).
No damage 0 %
Minor 0 %
Major 0 %
Destroyed 99.7 %
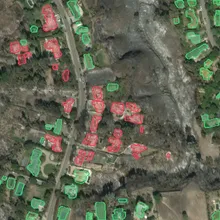 Damage per building
- frozen (pretrained)
- fine-tuned (pretrained, updated)
- trained for this task
Building identification
Mask R-CNN He et al., Mask R-CNN (2017) arxiv.org with a ResNet-50-FPN backbone, starting from COCO weights: ResNet-50 → feature pyramid → region proposals → RoIAlign → box head (building vs. background) and mask head (28 × 28 mask per building). The ResNet stem and first stage stay frozen; stages 2–4, the pyramid, the proposal network and both heads are fine-tuned on xBD footprints, with new two-class predictors. The training loss is the standard Mask R-CNN sum, with equal weights: proposal objectness (binary cross-entropy) and box offsets (smooth L1), building vs. background (cross-entropy) and box refinement (smooth L1), and the per-pixel mask loss (binary cross-entropy).
Two thirds of all buildings cover less than 32 × 32 px, so the detector is trained and run on 512 px tiles enlarged 2×. On validation this raised mask AP from 0.343 to 0.405 and small-building recall from 44% to 58%. With an existing building map, this stage is skipped.
Damage assessment
- Both dates are encoded by one DINOv3 ViT-L/16 DINOv3 (Meta AI) github.com , pretrained on satellite imagery (SAT-493M): 16 × 16 px patches → 24 transformer blocks → a 64 × 64 grid of 1024-d patch embeddings per date. Blocks 1–20 stay frozen; blocks 21–24 and the final norm (50M of 303M parameters) are fine-tuned.
- A scene context is kept per date: the mean of all patch embeddings of the pre- and of the post-event image.
- For each footprint, RoIAlign pools a 3 × 3 grid of patch embeddings on both dates. With the two scene contexts, each building has four raw vectors: pre building, post building, pre context, post context.
- Each is projected to 128-d, and a small MLP (512 → 128 → 4) classifies [post building, post context, Δ building, Δ context], where Δ = post − pre. The pre-event features enter only through the two Δ terms. The loss is cross-entropy over the four damage classes, unweighted.
Damage models tried
Recall per class with known footprints, test split:
| Damage model | No damage | Minor | Major | Destroyed |
|---|---|---|---|---|
| Post-image-only ResNet-18 (frozen, linear head) | 85.8% | 62.2% | 70.8% | 67.4% |
| Paired ResNet-18 (frozen, fusion head) | 96.8% | 40.7% | 67.7% | 75.8% |
| Frozen DINOv3 ViT-L (fusion head) | 97.6% | 51.1% | 74.6% | 84.2% |
| Fine-tuned DINOv3 ViT-L (selected) | 97.3% | 61.4% | 72.7% | 84.1% |
The post-image-only baseline reaches its minor-damage recall by labeling 14% of undamaged buildings as damaged. Among the models that keep no-damage recall above 96%, the fine-tuned ViT has the highest minor-damage recall. Models were selected on validation macro-F1 (the mean of the per-class F1 scores).
Results
Per-class recall
With known footprints, recall is 97% for no damage, 61% for minor, 73% for major and 84% for destroyed. With detected footprints, most of the loss comes from missed buildings: the detector finds 66% of undamaged and 72–80% of damaged buildings, and among the buildings it finds, recall per class is close to the known-footprint values.
-
No damage 41,427 buildings
Found 66% · right class when found 97% · end-to-end recall 63.8%
-
Minor 4,798 buildings
Found 72% · right class when found 59% · end-to-end recall 42.6%
-
Major 3,850 buildings
Found 80% · right class when found 75% · end-to-end recall 60.0%
-
Destroyed 3,775 buildings
Found 75% · right class when found 86% · end-to-end recall 64.9%
- found, right class
- found, wrong class
- missed by the detector
- recall with known footprints
Where buildings are lost
-
53,850 labeled buildings all test buildings with a damage label
-
Found · 36,604 68% of labeled buildings
-
Missed · 17,246 82% of them undamaged
-
Exact damage class · 33,227 90.8% of found buildings
-
One class off · 2,478 6.8% of found buildings
-
Two or more classes off · 899 2.5% of found buildings
-
Extra detections · 15,474 no labeled building there
Class confusion and detection
Minor damage is the hardest class: 28% of minor-damage buildings are predicted as undamaged.
Confusion with known footprints
| Reference ↓ · predicted → | No damage | Minor | Major | Destroyed |
|---|---|---|---|---|
| No damage | 97% 40,298 | 1.7% 705 | 0.6% 242 | 0.4% 182 |
| Minor | 28% 1,325 | 61% 2,945 | 7.8% 376 | 3.2% 152 |
| Major | 11% 426 | 9.5% 367 | 73% 2,799 | 6.7% 258 |
| Destroyed | 6.5% 246 | 1.8% 69 | 7.6% 286 | 84% 3,174 |
Building detector · test split
- Mask AP (IoU 0.50–0.95)
- 0.406
- Buildings found at score ≥ 0.5
- 68%
- Precision at score ≥ 0.5
- 0.70
- Small buildings found (< 32 × 32 px)
- 57%
All 54,862 test footprints, including the few without a damage label.
Examples
For comparison, the damage baseline in the xBD paper, which also classifies given building polygons, reports recall of 53% / 11% / 0.5% / 43% for the four classes. The xView2 challenge winners were much stronger, but they were scored on a pixel-level metric xView2 first-place solution github.com , which is not directly comparable to these per-building numbers.
Sensitivity analysis
- With the pre-event image given as both dates, the share of buildings predicted as damaged drops from 93.5% to 1.3% for destroyed, 88.9% to 0.3% for major and 72.4% to 0.4% for minor. The predictions depend on the post-event image, not on the pre-event appearance of the area.
- Δ features, the per-patch change in the encoder’s features between the two dates (1 − cosine similarity), is large over the burned houses and hillside of the wildfire scene and small over the intact houses at its edges. The classifier’s Δ inputs (post − pre) carry the same kind of signal for each building.
- For wildfires, predicted severity increases with colour and edge change inside the footprint and with lost vegetation around it, in line with the labels. Flood and earthquake damage changes few roof pixels, and predicted severity barely moves with these measures there.
1 · Pre-event image given as both dates
Share of test buildings predicted as damaged, by reference class: real images vs. the pre-event image in place of the post-event one.
-
Destroyed 3,775 buildings
93.5%1.3% -
Major 3,850 buildings
88.9%0.3% -
Minor 4,798 buildings
72.4%0.4% -
No damage 41,427 buildings
2.7%0.0%
real before / after pre-event image as “after”
2 · Predicted severity against image change inside each footprint
Validation buildings binned by measured pre → post change (deciles). Solid: mean predicted severity (0 = no damage … 1 = destroyed); dashed: mean reference severity.
Colour change inside the footprint
less change more change →
Edge-pattern change inside the footprint
less change more change →
Greenness change around the footprint, post − pre
← greenness lost gained →
Wildfire (Santa Rosa) Wind (Michael) Flood (Midwest) Earthquake (Mexico)
3 · Δ features: change in the encoder's features between dates
Δ features: for each patch, how much the encoder's post-event feature differs from its pre-event feature, measured as 1 − cosine similarity. Shown next to the predictions; bright = large Δ.
Next steps
Alignment is the first step of a deployment pipeline and the main open problem. The damage model needs building footprints that line up with the post-disaster image. In xBD, image pairs arrive aligned with their footprints; the dataset authors corrected post-event offsets per event. A real post-disaster image arrives with location metadata only, so it first has to be aligned to a pre-event reference with building footprints. Then the reference footprints are transferred and the damage model runs on them. Without a reliable alignment, the detector is the fallback, at the lower recall shown above.
Deployment pipeline
- InputPost-disaster imageWith GPS position and possibly the camera pose (orientation, altitude, lens).
- Step 1 · not built yetAlign to a pre-event referenceFind the matching pre-event image and its building footprints; estimate the transform.
- Step 2Transfer footprintsWarp the reference footprints onto the post-disaster image.
- Step 3 · this projectDamage per buildingPre/post embeddings, scene context and their differences per footprint.
No reliable alignment: detect buildings on the image instead (lower recall) and flag the area for review.
Approach to step 1, by available metadata
- GPS position, altitude, orientation and lens describe the camera.
- Project rays from the image corners to the ground: the image's ground footprint narrows the search and gives a first alignment.
- Fetch the pre-event reference and building footprints for that area.
- Refine with keypoint matching on non-building structure and RANSAC.
- Search radius = GPS error + visibility range (how far the camera sees from its altitude).
- Collect candidate reference tiles inside the radius, with their footprints.
- Rank candidates with an image embedder (nearest-neighbour search on global embeddings).
- Align the best candidates with keypoints and RANSAC; accept only if enough keypoints agree.
Keypoint matching on one test pair, buildings excluded
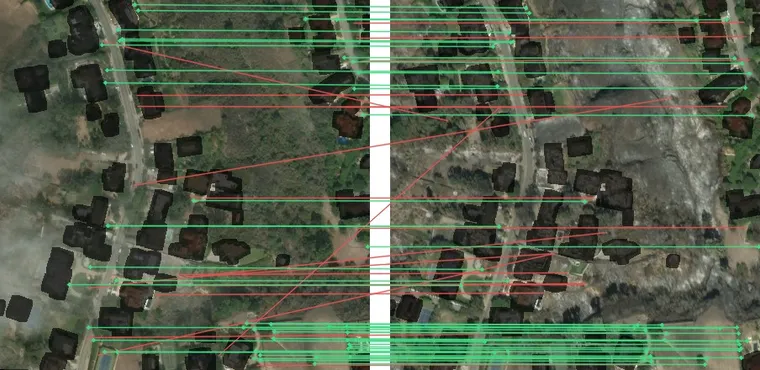
| All keypoints | Buildings excluded | |
|---|---|---|
| Area used for matching | 100% | 78% |
| Descriptor matches (ratio test) | 123 | 68 |
| Consistent after RANSAC | 68 | 47 |
| Median residual of the fit | 1.6 px | 1.1 px |
The approach depends on the available metadata. With the camera pose known (GPS position, altitude, orientation, lens), rays projected from the image corners to the ground give the image’s ground footprint, which narrows the search and gives a first alignment. With only a camera position, the search radius is the GPS error plus the visibility range; candidate reference tiles are ranked with an image embedder and aligned with keypoint matching. In both cases, keypoints should come from structure that is not being assessed — roads, bridges, rivers, forest and field edges — because buildings are what the model assesses and what the disaster changes. On the wildfire test pair, matching with every building masked out still finds 47 consistent matches with a median residual of 1.1 px.
Also next:
- Misalignment tolerance: shift the footprints synthetically and measure how recall degrades; this sets the accuracy the alignment step needs.
- Unseen disasters: all results come from ten events seen in training; hold out whole events.
- Detection fallback: 78% of missed buildings already have a correct outline with a low confidence score; a pilot that re-scores detections with ViT features improved validation results.
- Minor damage: pool features over the building mask instead of its box.
One training run per model; labels describe what is visible from above, not structural safety.