Fireline predicts which 375 m pixels of an active wildfire will be burning tomorrow, from the last five days of satellite, weather and terrain data. It also tests whether self-supervised pretraining (a JEPA) helps when labelled fires are scarce.
Dixie Fire, Northern California · 2021, test year
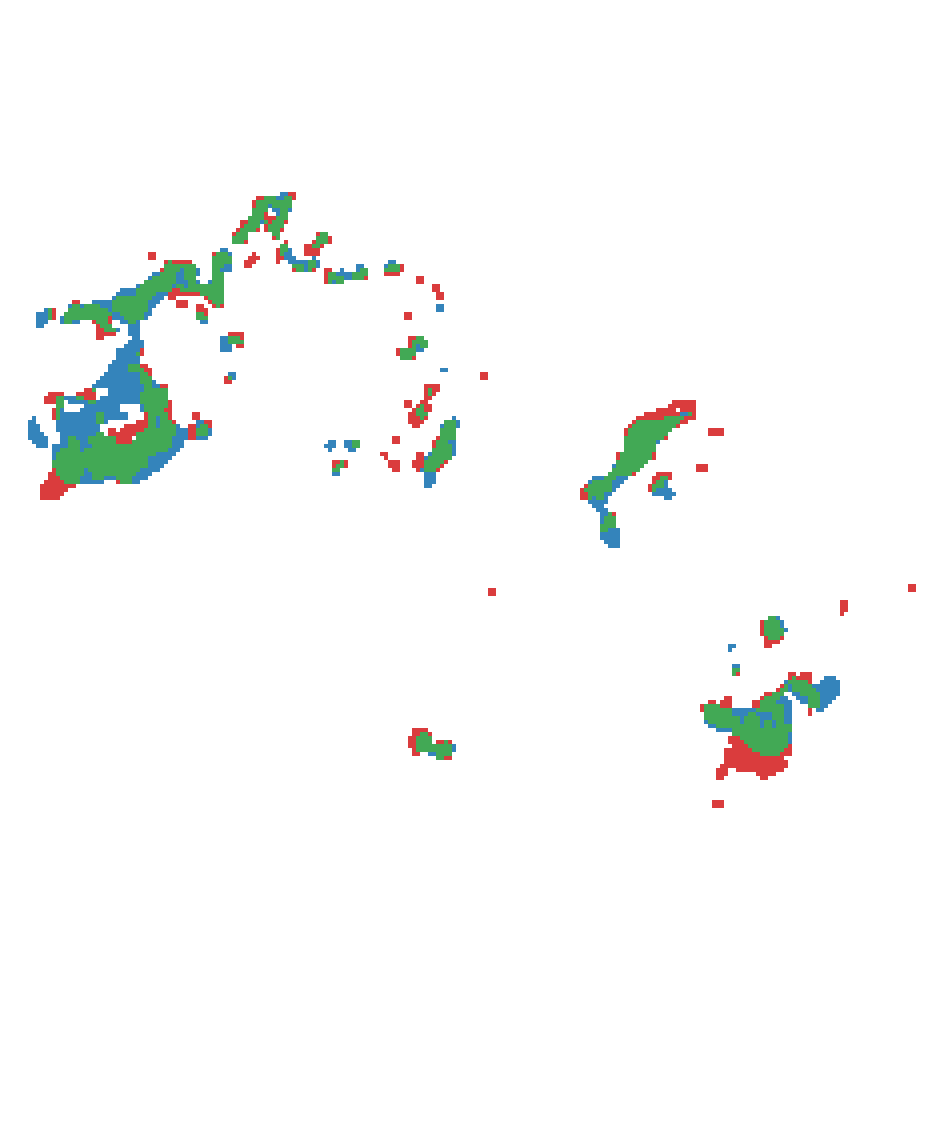 10 km
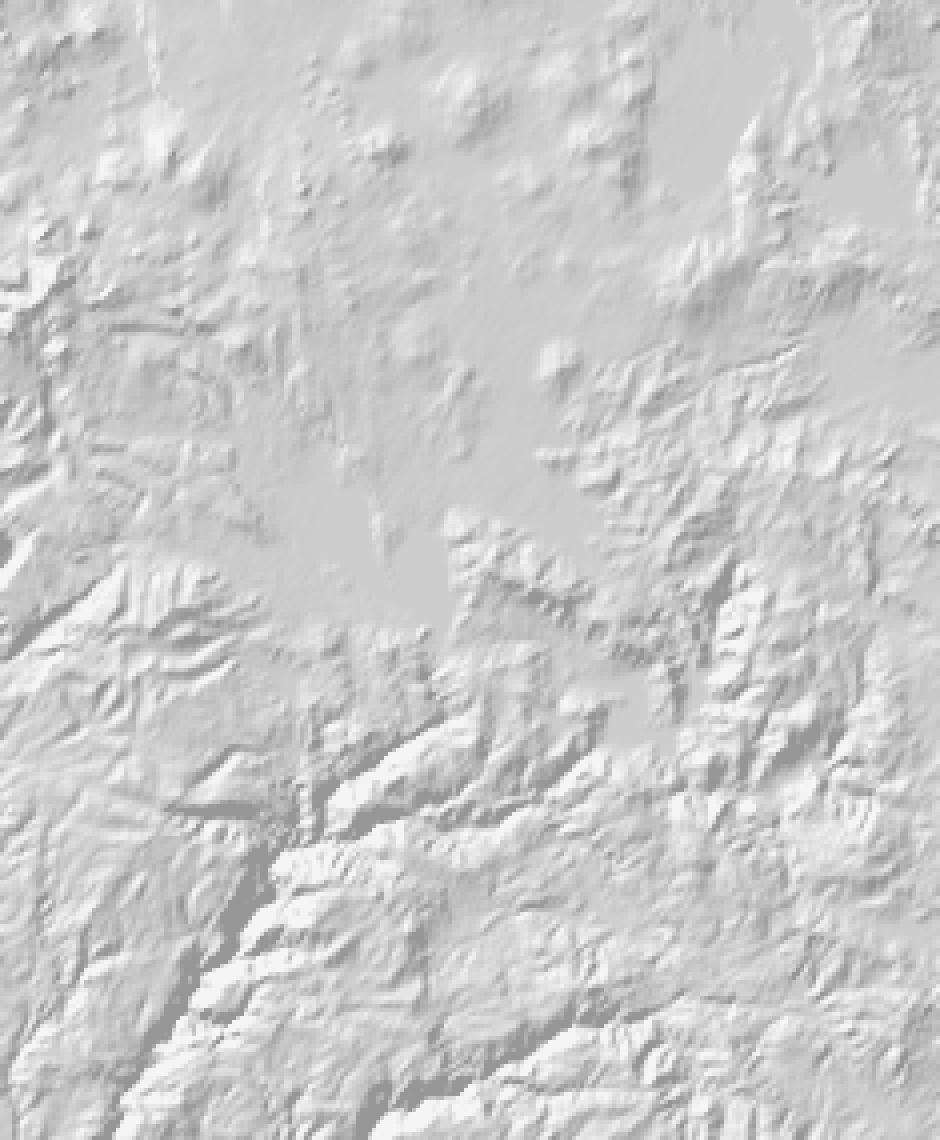
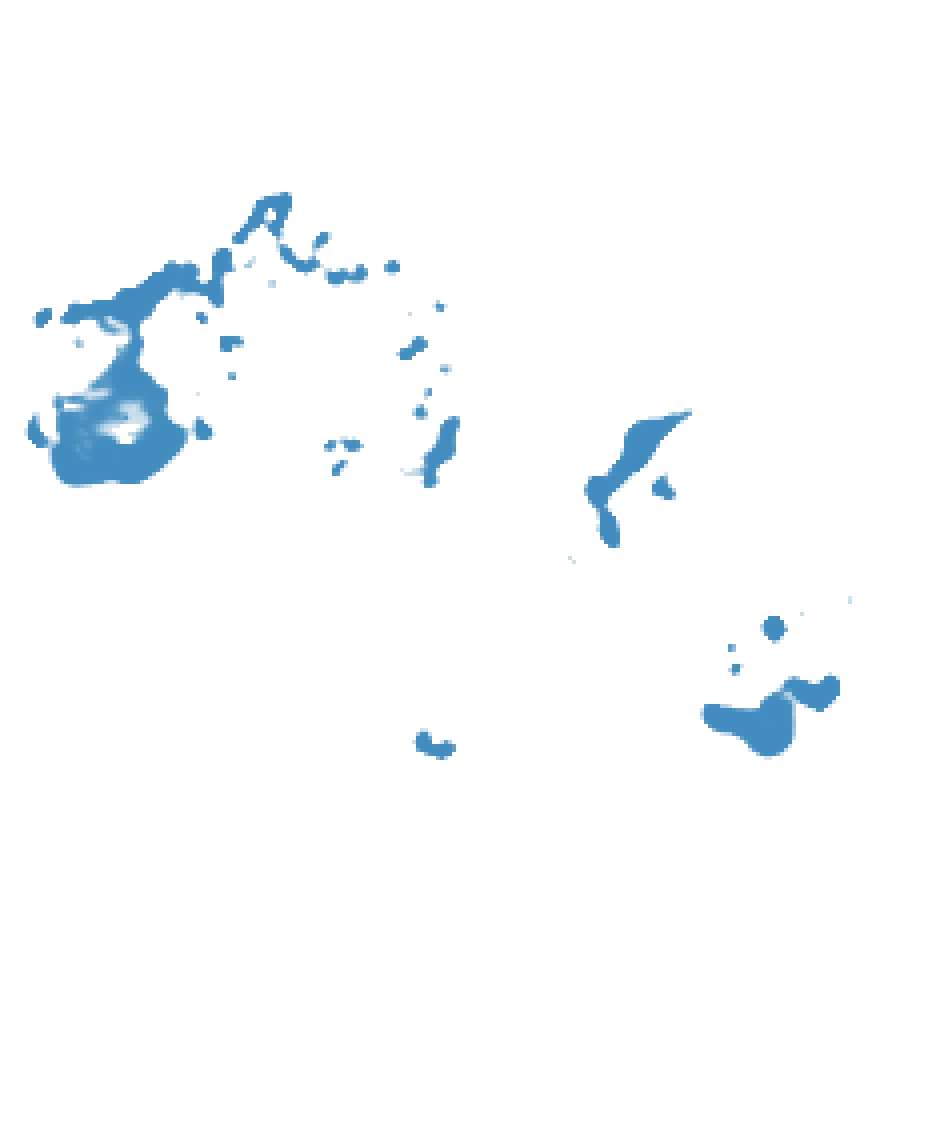
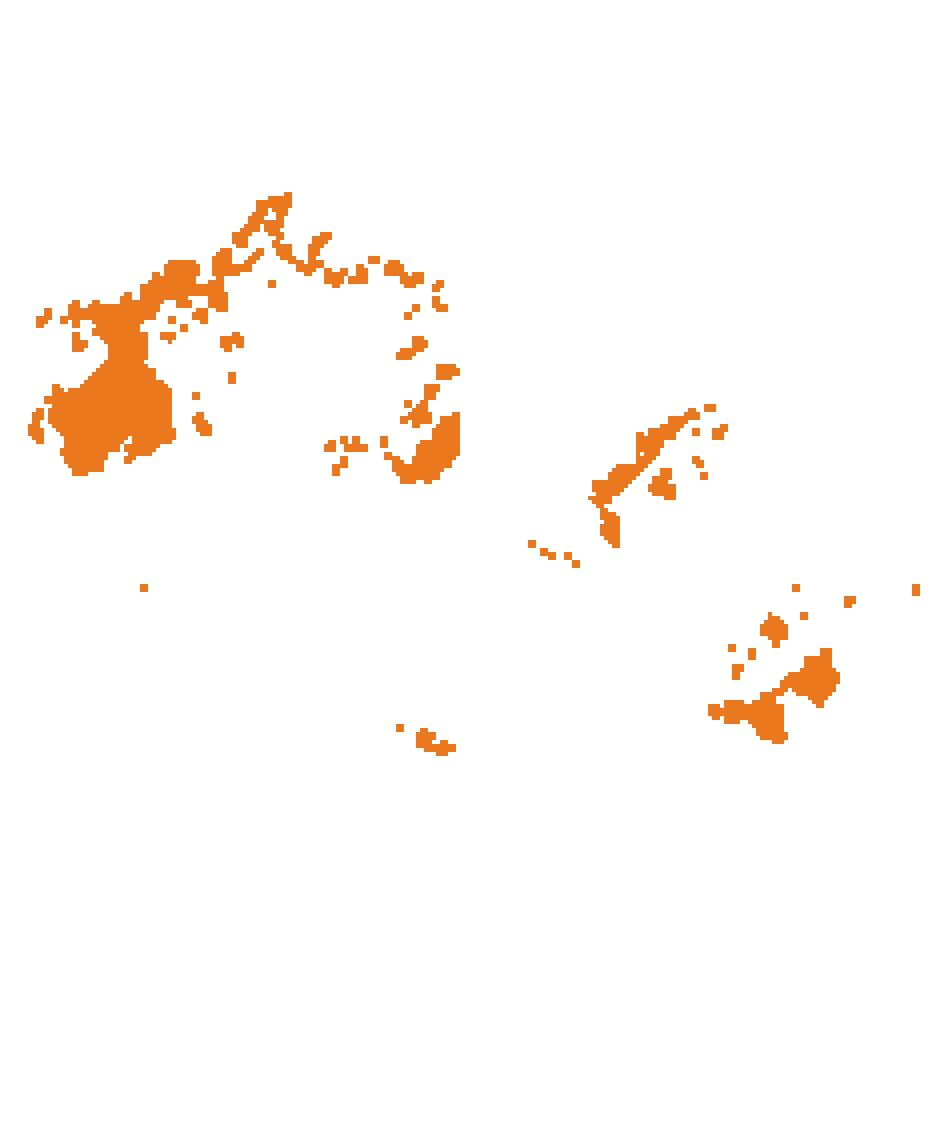
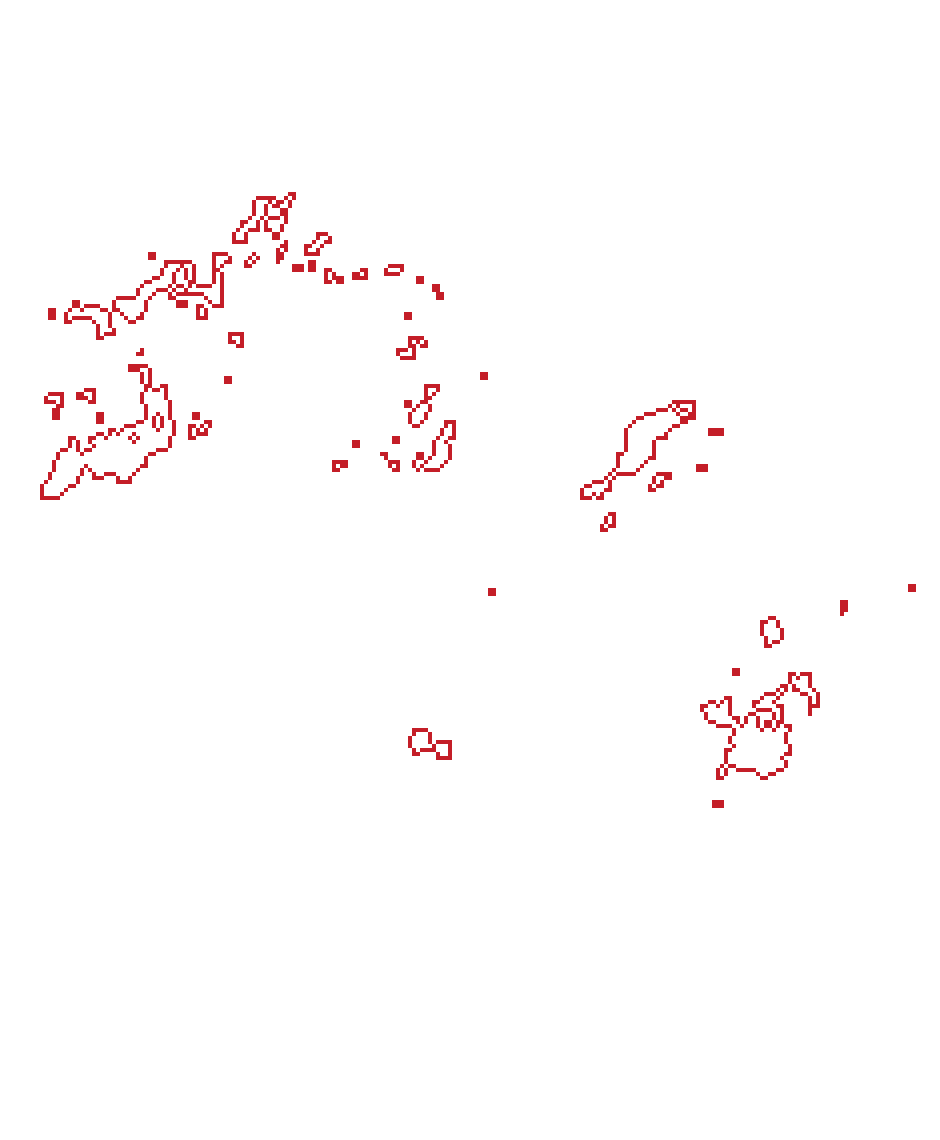
Aug 18 → Aug 19: 2,499 fire pixels today, 1,909 tomorrow.
- Fire today
- Predicted fire tomorrow (darker = more likely)
- Actual fire tomorrow
- Predicted and burned
- Missed
- False alarm
- Fire today
Aug 18 → Aug 19 351 km² burning today → 268 km² tomorrow · F1 0.65
| Method | AP | AP within 1.9 km | F1 at 0.5 | Validation AP |
|---|---|---|---|---|
| Persistence tomorrow's fire = today's fire | 0.287 | 0.383 | 0.535 | 0.196 |
| Neighbourhood share of today's fire in the surrounding 5 × 5 pixels (1.9 km) | 0.407 | 0.474 | 0.489 | 0.276 |
| Supervised U-Net U-Net on the previous 5 days, 1.5 M parameters | 0.567 | 0.640 | 0.590 | 0.458 |
Three findings carry the report. The model is good where the fire already is and poor where it jumps: most of its skill is within 750 m of today’s fire, and the largest day of the Dixie Fire in the timeline is mostly missed (Analysis). JEPA pretraining on the same fires did not beat a randomly initialised frozen encoder by more than run-to-run noise (Does JEPA pretraining help?). And the benchmark’s vegetation channels contain information from after the prediction day (A leak in the benchmark).
Task
Given five consecutive days of data for one fire, predict a probability of active fire for every pixel on the next day. The label is the next day’s VIIRS active-fire detection. Fire pixels are rare (0.3% of valid pixels), so results are reported as average precision (AP) over all pixels, and as F1 at a probability of 0.5.
Data
WildfireSpreadTS Gerard et al., WildfireSpreadTS: A dataset of multi-modal time series for wildfire spread prediction (NeurIPS 2023 Datasets and Benchmarks) proceedings.neurips.cc has one image per fire and day for 607 US fires from 2018 to 2021, with 23 channels: active fire, satellite reflectance and vegetation, observed and forecast weather, terrain and land cover.
Fires and daily images per year
- 2018 176 fires · 3,773 days · train
- 2019 74 fires · 1,425 days · train
- 2020 201 fires · 4,292 days · validation
- 2021 156 fires · 4,117 days · test
607 fires, 13,607 daily images in total; 375 m pixels.
23 input channels per day
- Fire
- VIIRS active fire (the target, also an input)
- Satellite
- VIIRS reflectance M11, I2, I1
- NDVI and EVI2 vegetation composites
- Weather (observed)
- precipitation, wind speed and direction
- min / max temperature, humidity
- energy release component, drought index (PDSI)
- Weather forecast
- precipitation, wind speed, temperature, humidity
- Terrain and land
- elevation, slope, aspect
- land cover (17 classes)
The split is by year, as a forecaster would face it: train on 2018–2019, choose every model and setting on 2020, and score 2021 once at the end. The forecast wind direction channel is dropped (it is wrongly encoded in the dataset), and observed wind is converted to east and north components.
Model
The model has to combine three kinds of information: where the fire is now and how it moved over the last days, the landscape it is moving into, and the weather. It is a U-Net, the standard architecture for per-pixel prediction, with one change: an encoder that reads one day at a time, followed by a step that fuses the five days. The figure follows one real sample through the network, the Dixie Fire on 18 August 2021, predicting 19 August.
AInputsfive days per sample · Aug 14 – Aug 18, predicting Aug 19
- day −4 Aug 14
- day −3 Aug 15
- day −2 Aug 16
- day −1 Aug 17
- today Aug 18
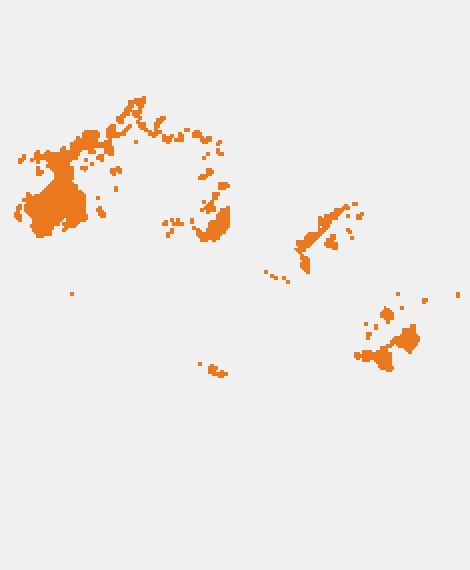 Active fire
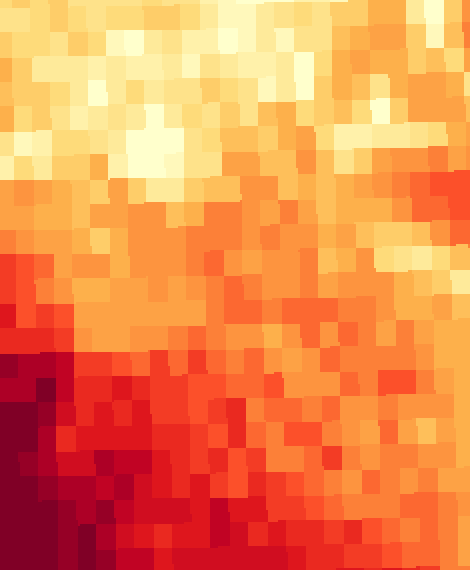 Energy release component
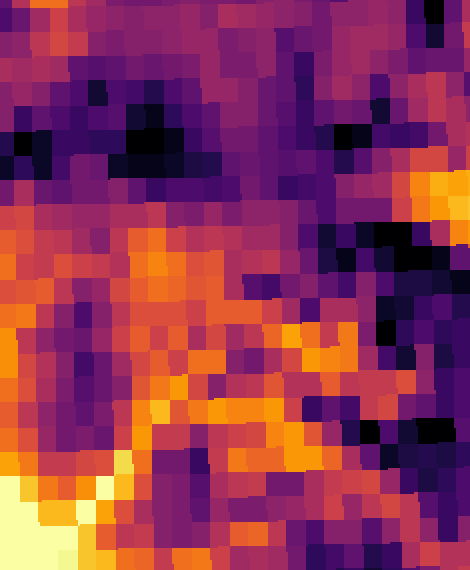 Max temperature
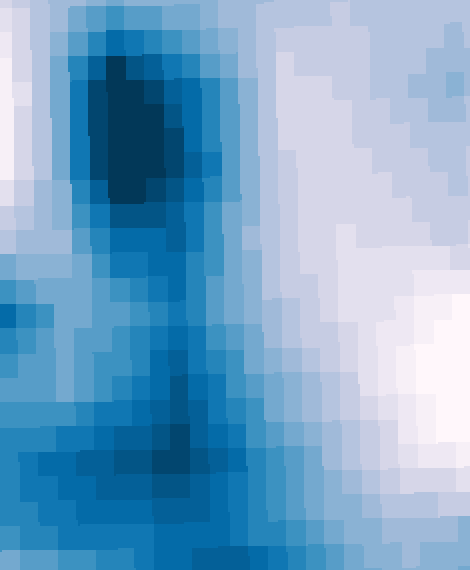 Wind speed
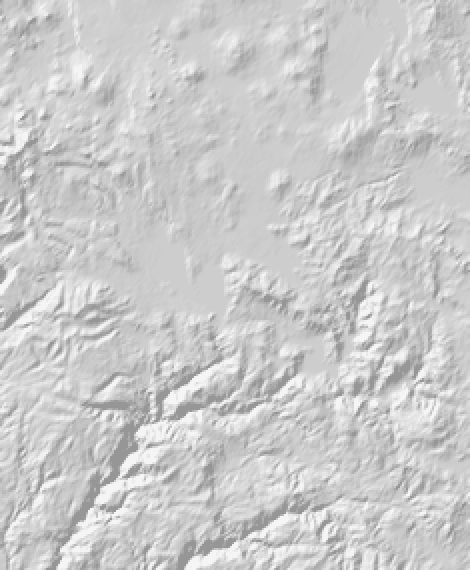 Elevation (shaded)
Six of 18 daily channels on Aug 18, plus 21 static channels (terrain, downslope direction, 17 land-cover classes). Weather comes at about 4.6 km, so it looks blocky at 375 m; vegetation composites have gaps, like this one.
BEncoderone CNN, the same weights for every day · 621,824 parameters
- Residual conv block 32 channels · 1 scale (375 m pixels) · full resolution
- Residual conv block, stride 2 64 channels · ½ scale (750 m pixels)
- Residual conv block, stride 2 128 channels · ¼ scale (1.5 km pixels)
- Residual conv block, stride 2 128 channels · ⅛ scale (3 km pixels) · latent grid
Each block: two 3 × 3 convolutions with group normalisation and GELU, plus a skip connection. Output: four feature maps per day, from fine detail at full resolution to a coarse 1/8 grid.
Full-resolution features, 32 channels
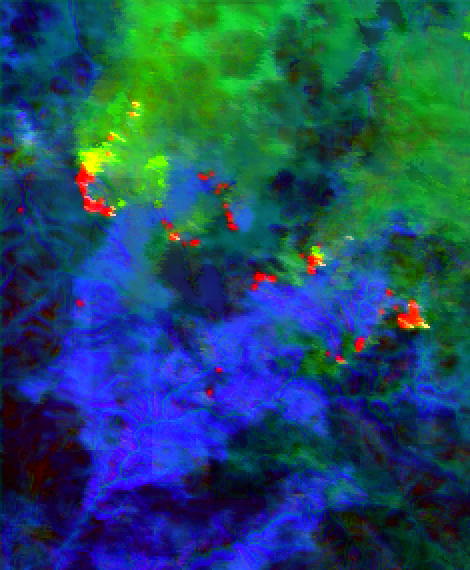 Aug 14
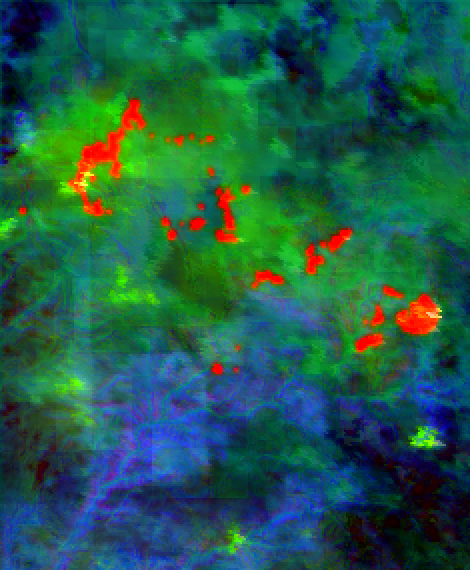 Aug 15
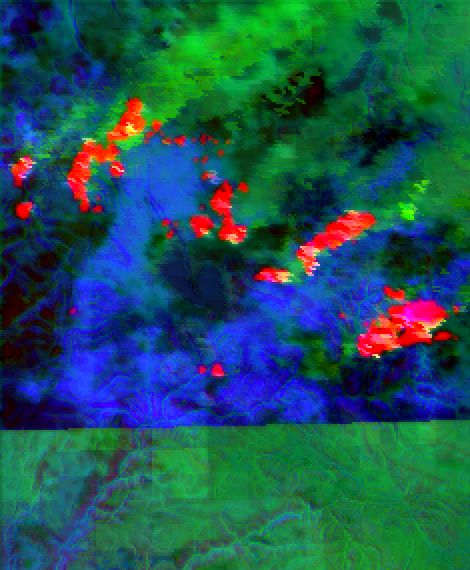 Aug 16
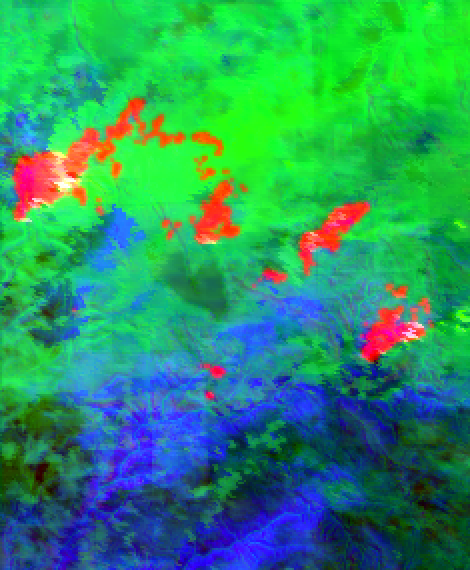 Aug 17
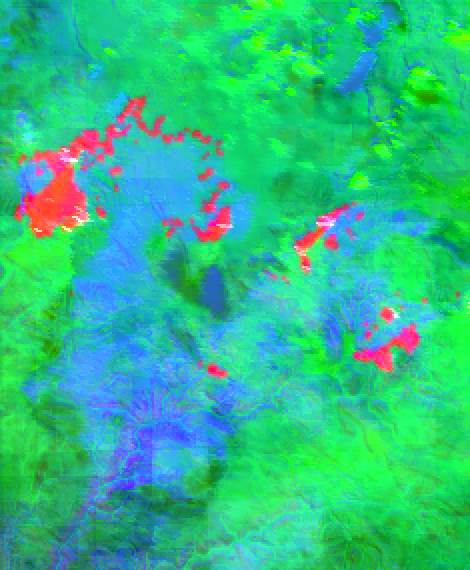 Aug 18
1/8 features, 128 channels
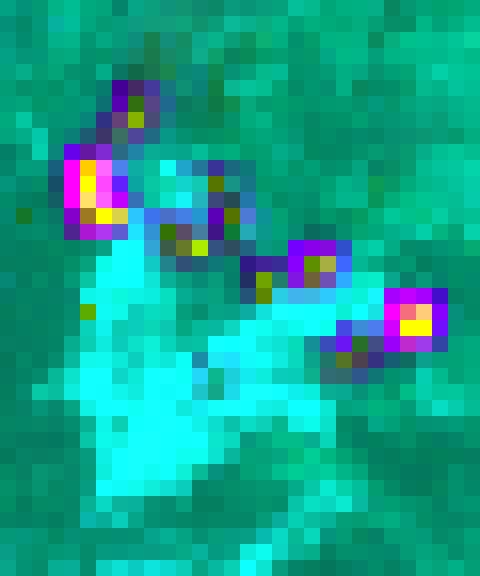 Aug 14
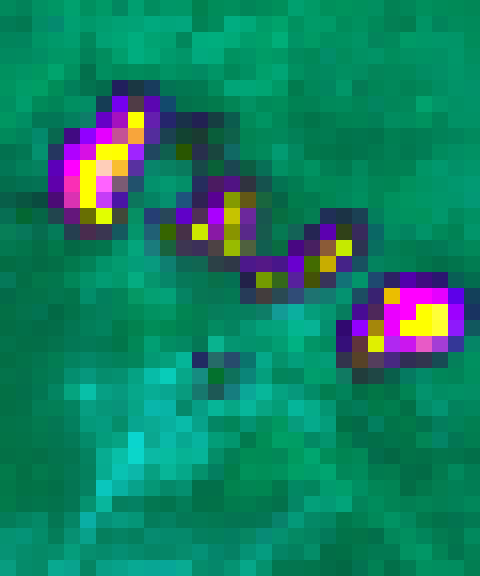 Aug 15
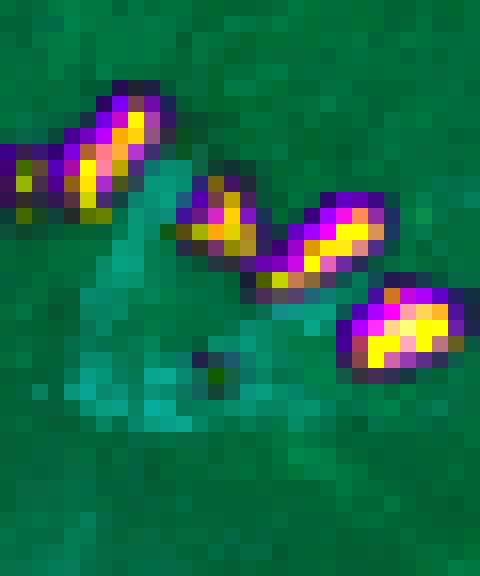 Aug 16
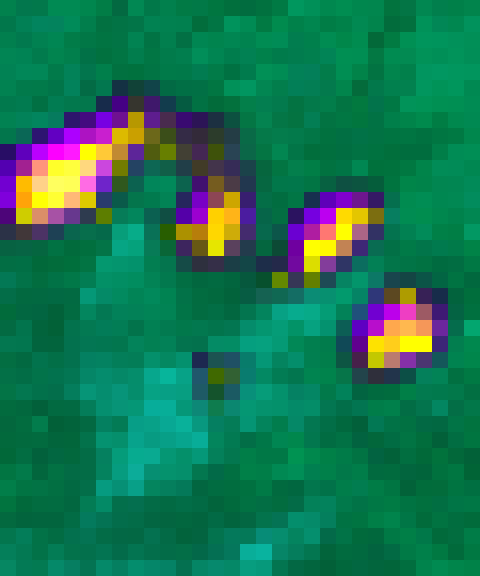 Aug 17
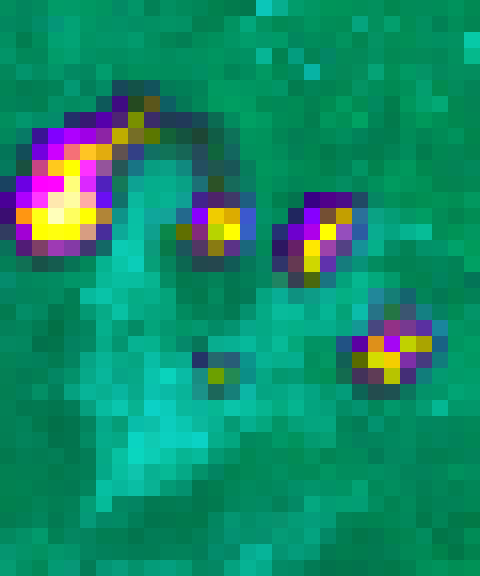 Aug 18
Colours are the first three principal components of each scale's features. The full-resolution maps follow terrain, vegetation and the fire; on the coarse grid the active fire areas stand out, and they move from day to day.
CFusion over daysat each of the four scales
5 × C channels → C channels, then group normalisation and GELU. The convolution learns how much each day and feature matters at every pixel: what burned today, what burned before, and how the weather changed.
- 1: 160 → 32
- ½: 320 → 64
- ¼: 640 → 128
- ⅛: 640 → 128
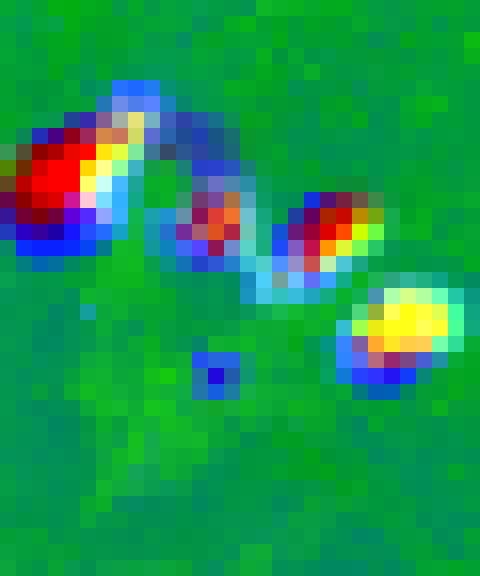 Fused 1/8 features
DDecoderU-Net upsampling with skip connections
- Upsample ⅛ → ¼, join fused ¼ featuresresidual conv block, 128 channels
- Upsample ¼ → ½, join fused ½ featuresresidual conv block, 64 channels
- Upsample ½ → 1, join fused full-resolution featuresresidual conv block, 32 channels
- Join today's fire maskraw, 1 channel, at full resolution
- Residual conv block, 1 × 1 convolution, sigmoidprobability of fire tomorrow
Fire fronts are a few pixels wide. Feeding today's fire mask straight to the last layer keeps them sharp; the deep path alone blurs them.
Training. 1,508,481 parameters. Loss: binary cross-entropy + soft Dice, over valid pixels (Dice counters the 0.3% fire share). AdamW, learning rate 0.001, weight decay 0.0001; 1 warm-up epoch, then cosine decay; gradient norm clipped at 1; batch 32; 30 epochs on 128 × 128 crops biased towards fire, with random flips and rotations. The epoch with the best validation AP is kept.
Inference. Whole images, padded by reflection to a multiple of 32; the padding is excluded from all scores.
Two design choices matter for the rest of the report. Because the encoder sees a single day, a self-supervised encoder of a single day can later be swapped in and frozen without changing anything else (the JEPA experiment). And because today’s fire mask reaches the output layer directly, the model can always fall back to “the fire stays where it is”, which is a strong prior: about half of tomorrow’s fire is burning today.
Results
How the Forecasts Are Scored
The model outputs a probability for every pixel. Turning that into a yes/no map needs a threshold, and every threshold trades two kinds of error: flag too much and most flagged pixels do not burn (low precision); flag too little and most of the fire is missed (low recall). Move the threshold below on one real day and watch the trade-off.
- Hits
- – flagged, and burned
- False alarms
- – flagged, no fire
- Misses
- – burned, not flagged
- Precision
- – hits ÷ flagged: when it says fire, how often is it right?
- Recall
- – hits ÷ burned: how much of tomorrow's fire does it find?
- F1
- – balance of the two at this threshold
This day's AP
–
AP (average precision) is the shaded area: precision averaged over every recall level, i.e. over all thresholds at once. 1.0 means every burning pixel is ranked above every other; random scores get the fire share, here –.
Average precision summarises the whole precision–recall curve in one number, so it does not depend on a chosen threshold. It is the right headline for a rare class: a model that says “no fire” everywhere is 99.7% accurate here, but its AP is the fire share, 0.003. All AP values in this report pool every valid pixel of every evaluated fire-day, so large fire days weigh more than small ones. F1 at a threshold of 0.5 is reported alongside, as the score of a fixed yes/no map.
Model Against Baselines
Two baselines use only today’s fire. Persistence predicts that tomorrow’s fire is today’s. The neighbourhood score is the share of fire among each pixel’s 5 × 5 neighbours (1.9 km), so pixels next to the fire rank above distant ones.
Test year 2021 · all pixels of 3,337 fire-days
-
AP ranking quality over all thresholds
0.290.410.57
-
F1 at 0.5 balance of precision and recall
0.530.490.59
-
Precision at 0.5 flagged pixels that burned
0.530.560.60
-
Recall at 0.5 burning pixels that were flagged
0.530.430.58
- Persistence
- Neighbourhood
- Supervised U-Net
On the test year the model reaches AP 0.567 against 0.407 and 0.287. Its gain over persistence in F1 is smaller (0.59 against 0.53), because persistence is already a decent yes/no map: most of tomorrow’s fire is today’s. What the model adds is ranking: it puts the pixels most likely to burn first, including pixels next to the fire that persistence cannot flag.
Scores are higher on 2021 than on the 2020 validation year for every method, the baselines included (persistence 0.287 against 0.196). 2021 has less fire far from the previous day’s, so it is an easier year. Methods are compared within one year throughout.
Analysis: Where Tomorrow’s Fire Comes From
A single AP hides where the model succeeds and where it fails. This section splits tomorrow’s fire by where it appears relative to today’s.
How Far Fire Moves Overnight
| Distance from today's fire | Share of tomorrow's fire | AP |
|---|---|---|
| On fire today | 53% | 0.53 0.57 0.77 |
| ≤ 750 m | 26% | 0.14 0.26 0.41 |
| 0.75–1.9 km | 8% | 0.03 0.03 0.16 |
| 1.9–3.75 km | 5% | 0.01 0.01 0.07 |
| 3.75–7.5 km | 2% | 0.00 0.00 0.02 |
| > 7.5 km | 2% | 0.00 0.00 0.00 |
| No fire today in the image | 3% | 0.00 0.00 0.05 |
- Persistence
- Neighbourhood
- Supervised U-Net
80% of tomorrow’s fire is either already burning or within 750 m of today’s fire, and that is where the model’s skill is: AP 0.77 on pixels burning today and 0.41 on the first 750 m. Each ring further out roughly halves the AP. Beyond 1.9 km it is below 0.1, and for fire in images with no fire today it is 0.05. The baselines cannot reach beyond 1.9 km at all, so the model’s gain is real at every distance, but small where it matters most for warning.
Good Days and Bad Days
The same split, per day: for each test fire-day, how well the model did against how much of the next day’s fire appeared far from today’s.
Test 2021 · 2,126 fire-days with at least 10 fire pixels tomorrow · median F1 0.53
Most fire-days are “close” days, and on those the model is consistent (pooled F1 0.64). On the 279 days where most of the next day’s fire is far away, F1 drops to 0.08: those are days the model does not see coming.
A Few Days Hold Most of the Far Fire
Share of all far fire, from the fire-days with the most far fire
- 2020 (validation): half of all far fire in 36 of 3,287 fire-days (1.1%)
- 2021 (test): half of all far fire in 105 of 3,337 fire-days (3.1%)
Far fire is not spread evenly. In 2020, half of it came from 36 fire-days, 1.1% of all fire-days; in 2021 it took 105 days (3.1%). These are the days that matter for warnings, such as a run or a large spot fire, and they are exactly the days a model trained on all days learns least about.
What the Inputs Can Explain
For each far fire pixel, the inputs were checked for a plausible cause, in order: was there fire nearby on the previous days (a re-flare or a missed detection), was today’s view blocked, and is the pixel downwind of today’s fire?
2020 (validation) · 23% of tomorrow's fire is far
The 10 fire-days with the most far fire hold 27% of it.
2021 (test) · 12% of tomorrow's fire is far
The 10 fire-days with the most far fire hold 17% of it.
- Burned nearby in the last few days a re-flare, or today's detection was missed
- No clear satellite view today clouds or gaps at the pixel
- Downwind of today's fire within 60° of the day's mean wind direction
- None of these new ignition, or a cause the inputs do not show
Most far fire has no visible cause in the inputs. Wind direction is weak evidence: a 120° downwind cone catches about a third of random directions, and 35–41% is only slightly more. The weather inputs are daily means at about 4.6 km, so the afternoon wind shift, gust front or lightning strike that starts a run is not in the data.
A Gap in the Record
The largest day of the Dixie Fire in the timeline shows how data gaps add to the problem.
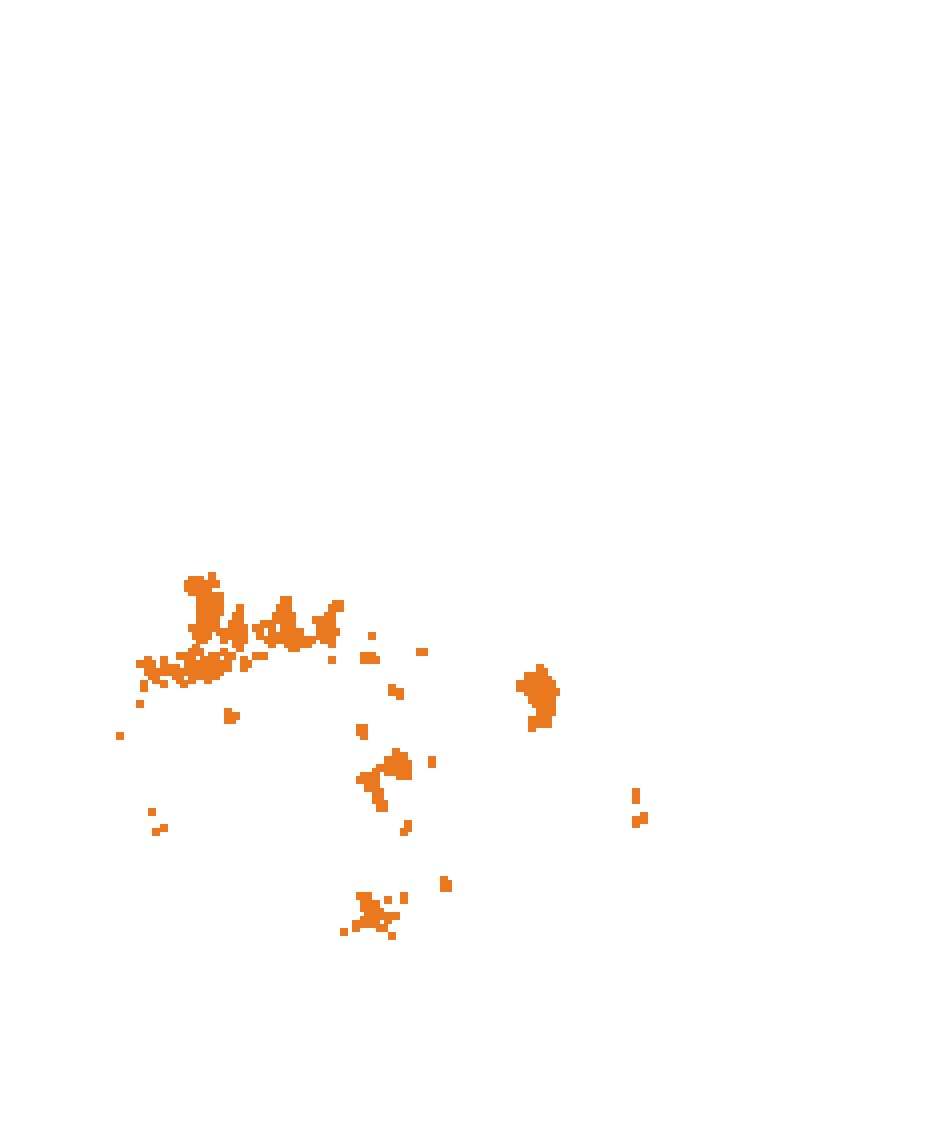
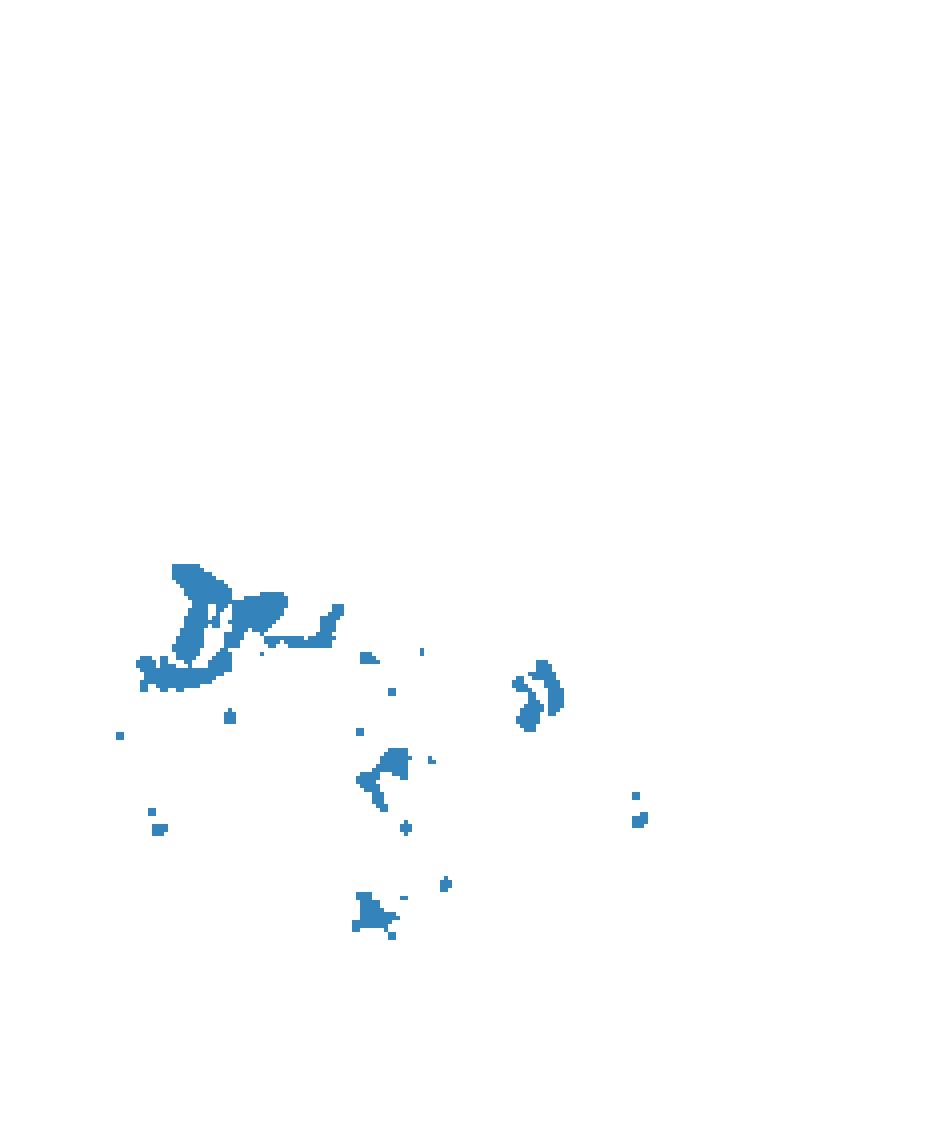
Aug 3 → Aug 4 today 919 · tomorrow 0 fire pixels 0 hits · 0 missed · 916 false alarms
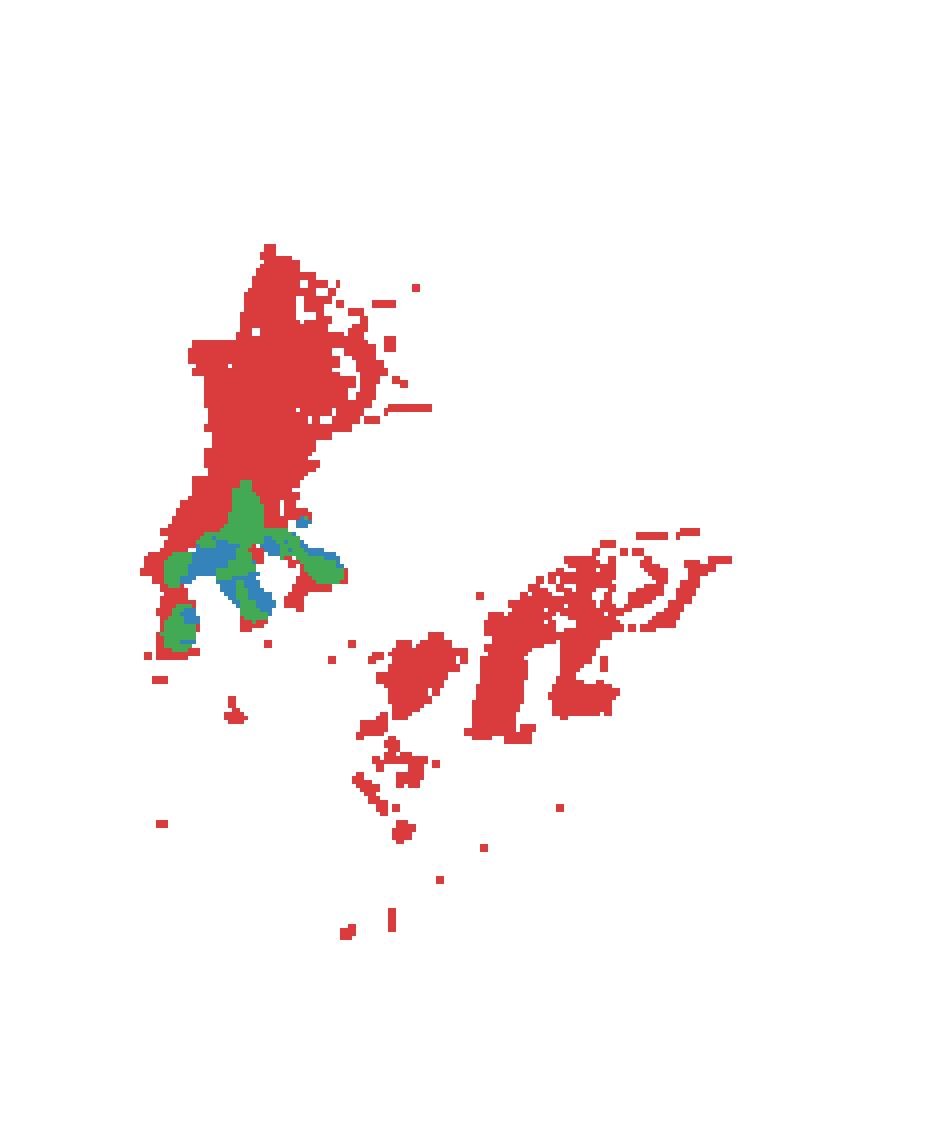
Aug 4 → Aug 5 today 0 · tomorrow 4,550 fire pixels 446 hits · 4,104 missed · 221 false alarms
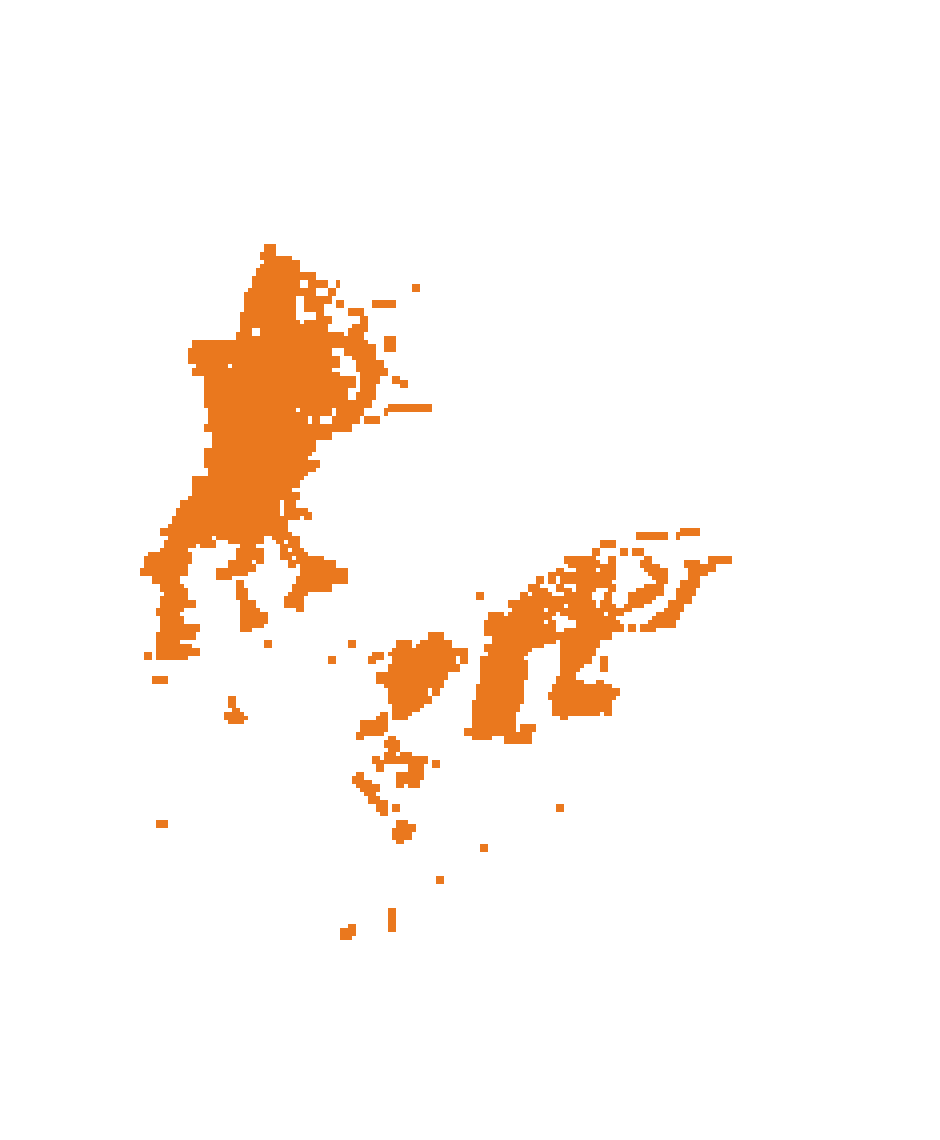
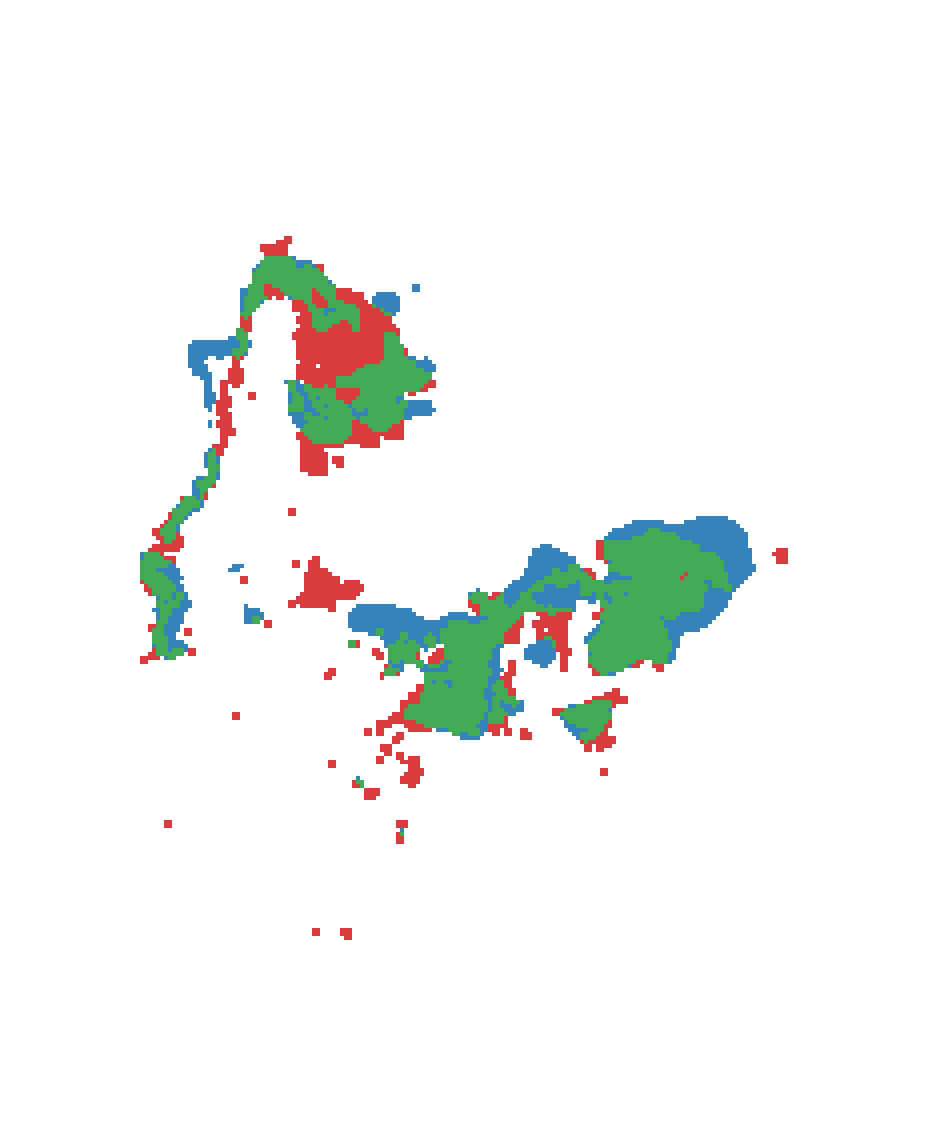
Aug 5 → Aug 6 today 4,550 · tomorrow 3,804 fire pixels 2,462 hits · 1,342 missed · 1,263 false alarms
- Fire today
- Predicted and burned
- Missed
- False alarm
There are no fire detections for this fire on 4 August, between 919 fire pixels on the 3rd and 4,550 on the 5th: a gap in the observations, not a pause in the fire. Gaps like this cost twice. The model’s sensible prediction for the 4th is scored as 916 false alarms, and on the 5th it has no “today” fire to extend. It still finds 10% of that day’s fire from the earlier days.
Does JEPA Pretraining Help?
The Idea
Supervised training uses a thin signal. The label is tomorrow’s fire mask, 0.3% of pixels are positive, and the training years provide about 5,200 labelled fire-days. Everything else in the scene, how vegetation dries, how heat builds, how the weather changes, is learned only as far as it helps predict that mask.
A joint-embedding predictive architecture (JEPA) Assran et al., Self-Supervised Learning from Images with a Joint-Embedding Predictive Architecture (I-JEPA, CVPR 2023) arxiv.org learns by predicting the representation of one part of the data from another, rather than its pixels. For video, the same idea learns motion and dynamics without labels Bardes et al., Revisiting Feature Prediction for Learning Visual Representations from Video (V-JEPA, 2024) arxiv.org . Fire spread is a forecasting problem, so the natural JEPA task is to predict tomorrow’s representation from the last five days.
Supervised U-Net learns from
Tomorrow's fire mask
- One label per pixel per day: fire or not, and only 0.3% of pixels are fire.
- Only labelled fire-days: 5,198 daily images from 250 fires to train on.
- Gradient signal sits at the fire edge; everything else in the scene is learned only as far as it helps that edge.
JEPA learns from
Tomorrow's whole scene, as a representation
- A target at every pixel, every day: how fire, vegetation, weather and heat change overnight.
- No labels needed: in principle any sequence of satellite days, with or without fire, can be used.
- Prediction in representation space: the model can ignore what cannot be predicted (clouds, sensor noise, detection gaps) instead of spending capacity on reconstructing pixels.
The bet: an encoder trained to forecast the scene's next state learns the dynamics that drive spread, and a small head on top needs few labelled fires to turn that into a fire forecast.
Setup
1Pretraining: predict tomorrow's representationno fire labels as targets
Context: days t−4 … t
↓
Target: day t + 1
↓
- JEPA-next: target = tomorrow's latent
- JEPA-weighted: same, loss weighted on cells where the fire changes
- JEPA-change: predicts the change from today's latent; the loss is divided by the error of predicting no change, so a representation that barely changes does not make the task easy
↓ freeze the encoder
2Probe: the same spread model, encoder frozenfire labels used here only
The pretrained encoder replaces the spread model's encoder and is frozen; fusion and decoder (886,657 parameters) are trained exactly as in the supervised model and selected on validation. Control: the same probe on a frozen random encoder, which shows what the decoder achieves with features that encode nothing learned.
The experiment was pre-registered: before any JEPA result, three gates were fixed that decide whether the approach is viable. The representation must not collapse (effective rank above a quarter of its 128 dimensions). The predictor must beat the trivial forecast “tomorrow’s representation equals today’s” by at least 10% on cells near the fire. And a frozen encoder must reach validation AP within 0.03 of the supervised model (0.43 or more).
Experiments and Results
Gate: does the predictor beat "tomorrow = today" near the fire?
-
JEPA-next Predict tomorrow's latent map; loss: squared error, weighted near fire
1.01 × copy error · fails
-
JEPA-weighted Predict tomorrow's latent map; loss: squared error, weighted where the fire changes
1.01 × copy error · fails
-
JEPA-change Predict the change from today's latent; loss: squared error divided by that of predicting no change
0.67 × copy error · passes
Next-day AP with the encoder frozen · test 2021 (validation 2020)
- Supervised U-Net (trained end to end) 0.567 (0.458)
- JEPA-change, frozen encoder 0.514 (0.403)
- Random frozen encoder 0.497 (0.388)
- JEPA-next, frozen encoder 0.451 (0.359)
Validation AP during probe training (2020), encoder frozen except for the supervised model
None of the variants collapsed (effective rank 125–127 of 128). JEPA-next and JEPA-weighted failed the second gate: their predictor was no better than copying today’s representation (1.01 times the copy error). JEPA-change, which predicts the change, passed it with 0.67 times the copy error, but its frozen encoder reached AP 0.403 on validation, below the 0.43 bar, and 0.514 on the test year. That is 0.015 and 0.017 above the random encoder: the same direction in both years, but within the noise of a single run. The verdict, by the rule fixed in advance, is not viable.
Why It Failed
Test AP, adding one part at a time
-
Persistence tomorrow = today
0.287 -
Neighbourhood today's fire, blurred over 1.9 km
0.407 +0.120 -
Random frozen encoder untrained encoder; fusion and decoder trained
0.497 +0.089 -
Supervised U-Net encoder trained too
0.567 +0.071
Three things worked against it, and the ladder above shows the most important one.
The encoder had little room to help. A frozen, untrained encoder with a trained fusion and decoder already reaches 0.497, 88% of the full model. Most of the skill comes from today’s fire, which reaches the decoder directly, and from what the decoder learns. Training the encoder end to end adds 0.07 AP; JEPA-change recovered about a quarter of that.
Copying was almost the right answer. In JEPA-next the representation barely changed from one day to the next: the error of copying today’s representation was 0.013, about 1% of the target’s variance. Terrain, land cover and most of the weather are the same tomorrow, so an encoder can satisfy “predict tomorrow” by encoding what does not change. Weighting the loss towards fire cells (JEPA-weighted) did not change this. Predicting the change (JEPA-change) forced the predictor to model what moves, but what moves from day to day is mostly the fire itself, which the decoder already sees.
The pretraining saw no more data than the supervised model. JEPA results in vision come from pretraining on far more unlabelled data than labelled data. Here both used the same 2018–2019 fires, about 5,200 days, so the test was whether the objective helps on the same data, not whether more data does. And the information that would explain far fire (sub-daily wind, lightning) is not in the inputs, so no objective could learn it.
Where It Could Work
The negative result is specific to this setting, and it points to where JEPA has a better chance:
- Far more unlabelled data. Daily satellite and weather data exist for every day of every year over fire-prone land, with or without fire. That is orders of magnitude more than the labelled fire-days, and it is the regime in which self-supervised pretraining usually pays off.
- Few labels. The probe here had all the labelled fires. Pretraining is most useful when labels are scarce, for example a new region or sensor; training the probe on a tenth of the fires would test that directly.
- Richer dynamics. With sub-daily inputs (geostationary fire detections every few minutes, hourly wind), “predict the next state” contains far more than the static landscape, and copying stops being a good answer.
- A shared representation. A forecasting encoder could serve several tasks at once: spread, burn severity, smoke. That is where a frozen, general encoder would earn its keep over a model trained for one task.
A Leak in the Benchmark
What the NDVI channel on day t contains
- 16-day composite window (here starting 4 days before t)
- days after t inside the window
Mean NDVI change when the composite updates
The NDVI and EVI2 channels are 16-day vegetation composites, updated every 8 days. The value on day t comes from the latest composite whose window started within the previous 15 days, so the window always reaches 8 to 15 days past t: part of each composite is observed after the prediction day. If a pixel burns inside that window, its vegetation index already drops at the composite update, before it burns.
Per fire: NDVI drop of pixels about to burn, beyond that of their unburned neighbours
The effect is modest but consistent: AUC 0.61–0.63 in every year, and the same direction in 287 of 493 fires. Results here use the channels as published, for comparability with other work on the benchmark; the leak is a property of the data, not of this model. A deployed model would need vegetation composites that end before the prediction day.
What Didn’t Help
If far fire is often downwind, giving the model explicit wind and distance features should help it look in the right direction. This was pre-registered with a target of +20% AP at 0.75–3.75 km from today’s fire.
| Distance from today's fire | Validation 2020 | Test 2021 |
|---|---|---|
| 0.75–1.9 km | 0.197 → 0.206 +5% | 0.164 → 0.176 +7% |
| 1.9–3.75 km | 0.085 → 0.096 +13% | 0.072 → 0.081 +13% |
| All pixels | 0.458 → 0.458 +0% | 0.567 → 0.560 -1% |
Validation AP during training (2020)
The model already derives most of this from the fire mask and wind channels; the features only make it learn faster. What is missing is information, not presentation: daily mean wind at 4.6 km cannot show the gust that throws embers a kilometre ahead.
Limitations and Next Steps
Most of the limits on this model are limits of the data, and each has a concrete fix.
-
One fire map per day
VIIRS satellites pass over a few times a day and WildfireSpreadTS keeps one fire map per day. Smoke, clouds and gaps hide fire; runs that start and end between passes are invisible.
Seen here: The Dixie Fire has no detections on 4 August, between two of its largest days. 6% of far fire in 2021 appears at pixels with no clear view on the last input day.
Next: Geostationary fire detections (GOES-16/17, every 5–15 minutes at about 2 km) to fill gaps and give timing within the day.
-
Weather as daily means at about 4.6 km
Wind and humidity come from a daily gridded product. The afternoon wind shift or gust front that drives a run is averaged away, and the whole fire often sits in a few weather cells.
Seen here: Downwind explains 35%–41% of far fire, barely above the third expected by chance; explicit wind features did not help.
Next: Hourly, 3 km wind and humidity from a weather model analysis (for example HRRR), including gusts.
-
No ignition sources
New fires and spot fires start from lightning, embers and people. None of these is an input.
Seen here: 39% of far fire in 2021 (52% in 2020) has no nearby recent fire, no observation gap and is not downwind.
Next: Lightning strikes (ground networks or the GOES lightning mapper); roads and settlements as human-ignition proxies.
-
Vegetation from the future, or missing
NDVI and EVI2 are 16-day composites whose window extends past the prediction day; some days have no composite at all.
Seen here: AUC 0.62 for the pre-burn drop; the Dixie Fire has no composite for 13–20 August.
Next: Vegetation indices from reflectance up to the prediction day only (daily surface reflectance or a trailing composite).
-
Labels are detections, not burned area
A 375 m pixel is labelled fire when VIIRS sees a hotspot in it. Low-intensity or smouldering fire is missed and the same ground can flare again, so the label is noisy.
Seen here: Fire that vanishes for a day and returns counts as new fire: 20% of far fire in 2021 (7% in 2020) is next to fire seen in the previous days.
Next: Combine detections with daily perimeters or burn-scar maps to train on area that actually burned.
-
Few fires, one run per arm
607 fires in four years; every comparison here is one training run.
Seen here: Differences below about 0.03 AP are not resolved, including JEPA-change against the random encoder.
Next: More fire seasons, several seeds per arm, and unlabelled satellite years for pretraining.
Next Steps for Far Fire
The model is already good near the fire; the open problem is fire that appears far from it. The plan runs from cheap to large: first change what the model trains on, with the data it already has; then add the inputs that far fire depends on; then build a larger dataset, which also gives a clean new test season.
Next steps for far fire, from cheapest to largest
- 1
Train on what matters
current data · one training run each- Oversample far-fire days, upweight far pixels
Half of all far fire sits in 1–3% of fire-days, and training crops centre on today's fire, so the loss barely sees it.
- Predict at 3 km, not 375 m
A warning needs “new fire likely in this cell”, not the exact pixel of a spot fire. Score it with a matching coarse metric.
- Use the recent fire better
Fire returning near earlier fire (20% of far fire in 2021, 7% in 2020) is already in the five input days, and the model still misses it.
- Oversample far-fire days, upweight far pixels
- 2
Add the missing inputs
public data · a pipeline per source- Fire intensity (FRP) and every satellite pass NASA FIRMS VIIRS archive
Intense fires throw embers further; day and night passes show where the fire moved, not one map a day.
- Hourly wind, gusts and humidity at 3 km HRRR analysis
Far fire downwind of today's (35% of far fire in 2021, 41% in 2020) is driven by the afternoon wind, which daily means hide.
- Fire detections every 5–15 minutes GOES fire product
Fills detection gaps like the Dixie Fire's 4 August (6% of far fire in 2021, 1% in 2020) and gives timing within the day.
- Lightning, roads and settlements GOES lightning mapper, OpenStreetMap
Fire with no visible cause (39% of far fire in 2021, 52% in 2020) likely includes many new ignitions, from lightning and people.
- Fire intensity (FRP) and every satellite pass NASA FIRMS VIIRS archive
- 3
More fires
the largest gain, the largest build- More years: 2012 onwards
VIIRS fire detections start in 2012. Rebuilding the dataset from the same public sources would more than triple the fire seasons, and far-fire days with them.
- A new held-out test: 2022 onwards
2021 has been scored once. Every change above is chosen on 2020, and a fresh season is needed to test it cleanly.
- Unlabelled years for pretraining
Daily inputs exist with or without fire. This is the setting in which JEPA pretraining could pay off, and it tests the idea properly.
- More years: 2012 onwards
Alongside these, every comparison here is a single training run, so several seeds per arm would resolve differences below 0.03 AP, including JEPA-change against the random encoder.